Summary: This post tells you how to track process creation and exit events using the Process Monitor utility.
My previous post, List Running Processes, helps you track down currently running processes. And the article Command Prompt Opens and Closes immediately tells you if a last run program window was a scheduled task or not.
While those posts can be useful for knowing what’s running in the system, there is still something missing using those methods.
The first post talks about Process Explorer, which shows the real-time view of running processes. But it doesn’t keep track of processes that ran a few minutes before and then terminated.

Process Explorer highlights new processes for a couple of seconds, but it doesn’t record a history of creation and termination time or processes. And the second link above deals only with Scheduled Tasks. However, you may need to get the list of processes (especially the short-lived processes) that ran for some time and then terminated. Process Monitor can be helpful in getting that info.
Use Process Monitor to Track Process Start and Exit Events
Start Process Monitor, enable the Process activity button, and disable the other buttons.

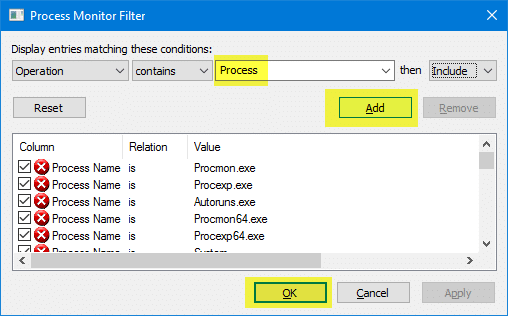
Then click the Filter button (or press Ctrl + L) to launch the Process Monitor Filter dialog.
Configure the filters as follows:
Operation → contains → Process

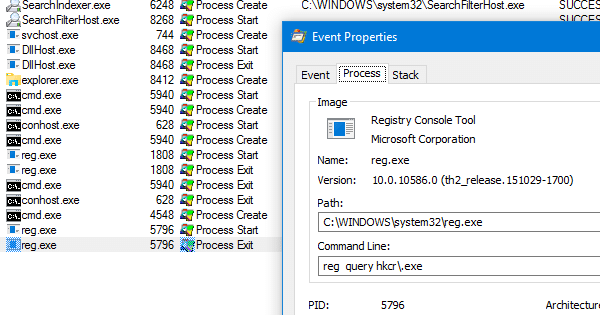
Click Add, OK. Process Monitor would start capturing events and display results containing Process Create, Process Start, and Process Exit under the Operation column.
Quick Tip: If you’re going to run the trace for a long period of time, then consider enabling Drop Filtered Events under the Filter menu. This makes sure your memory or disk is not filled up unnecessarily; it only keeps the record of events that have passed your filter.
Here you go! Process Monitor has recorded some Process Start and Process Exit events. To know more details of an event, double-click the entry. It shows the full command-line and path of that process.

Additional Information
Enable the Sequence Number and other columns
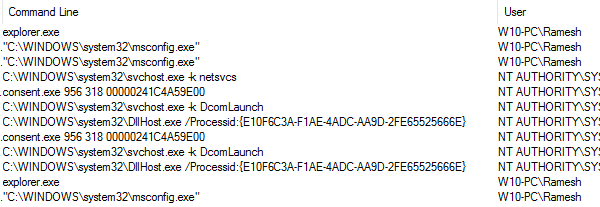
You can enable the Command Line column in Process Monitor Column Selection dialog. From the Options menu, click Select Columns… and enable Command Line, and Sequence Number.
Now, a column named “Command Line” appears in the results window.

Process Tree
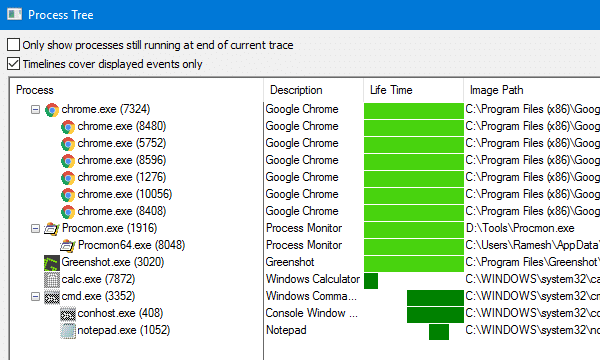
You can view the list of processes in a tree format showing the Parent Processes, Path, Life Time, and other information. From the Tools menu, click Process Tree (Ctrl + T).

To make the Life Time bar graph use the trace time (i.e., capture start time) instead of the boot session as the baseline, enable Timelines cover displayed events only.
Save the Log file
For future analysis, save the events to a .PML file containing All Events (if “Drop Filtered Events” wasn’t enabled during the trace) or currently shown events. If you plan to share the log file with an analyst, please zip the file before sending it. Compressing reduces the .PML log file size by 90%.
One small request: If you liked this post, please share this?
One "tiny" share from you would seriously help a lot with the growth of this blog. Some great suggestions:- Pin it!
- Share it to your favorite blog + Facebook, Reddit
- Tweet it!